Documentation Index
Fetch the complete documentation index at: https://openmetadata-feat-feat-2mbfixdeploy.mintlify.app/llms.txt
Use this file to discover all available pages before exploring further.
Service Insights
Users can view insights for individual services using the Service Insights tab. This guide provides an overview of the available charts and outlines troubleshooting steps when no data is displayed.Total Data Assets
This chart displays the total number of data assets within a service, categorized by asset type. For example, in a database service, it shows the count of tables, databases, database schemas, and stored procedures.Description Coverage
This chart shows the percentage of data assets that have a populated description field.PII Coverage
This chart displays the percentage of data assets containing columns tagged with Personally Identifiable Information (PII) tags.Tier Coverage
This chart displays the percentage of data assets where tier classification has been populated.Ownership coverage
This chart shows the percentage of data assets that have a populated owner field.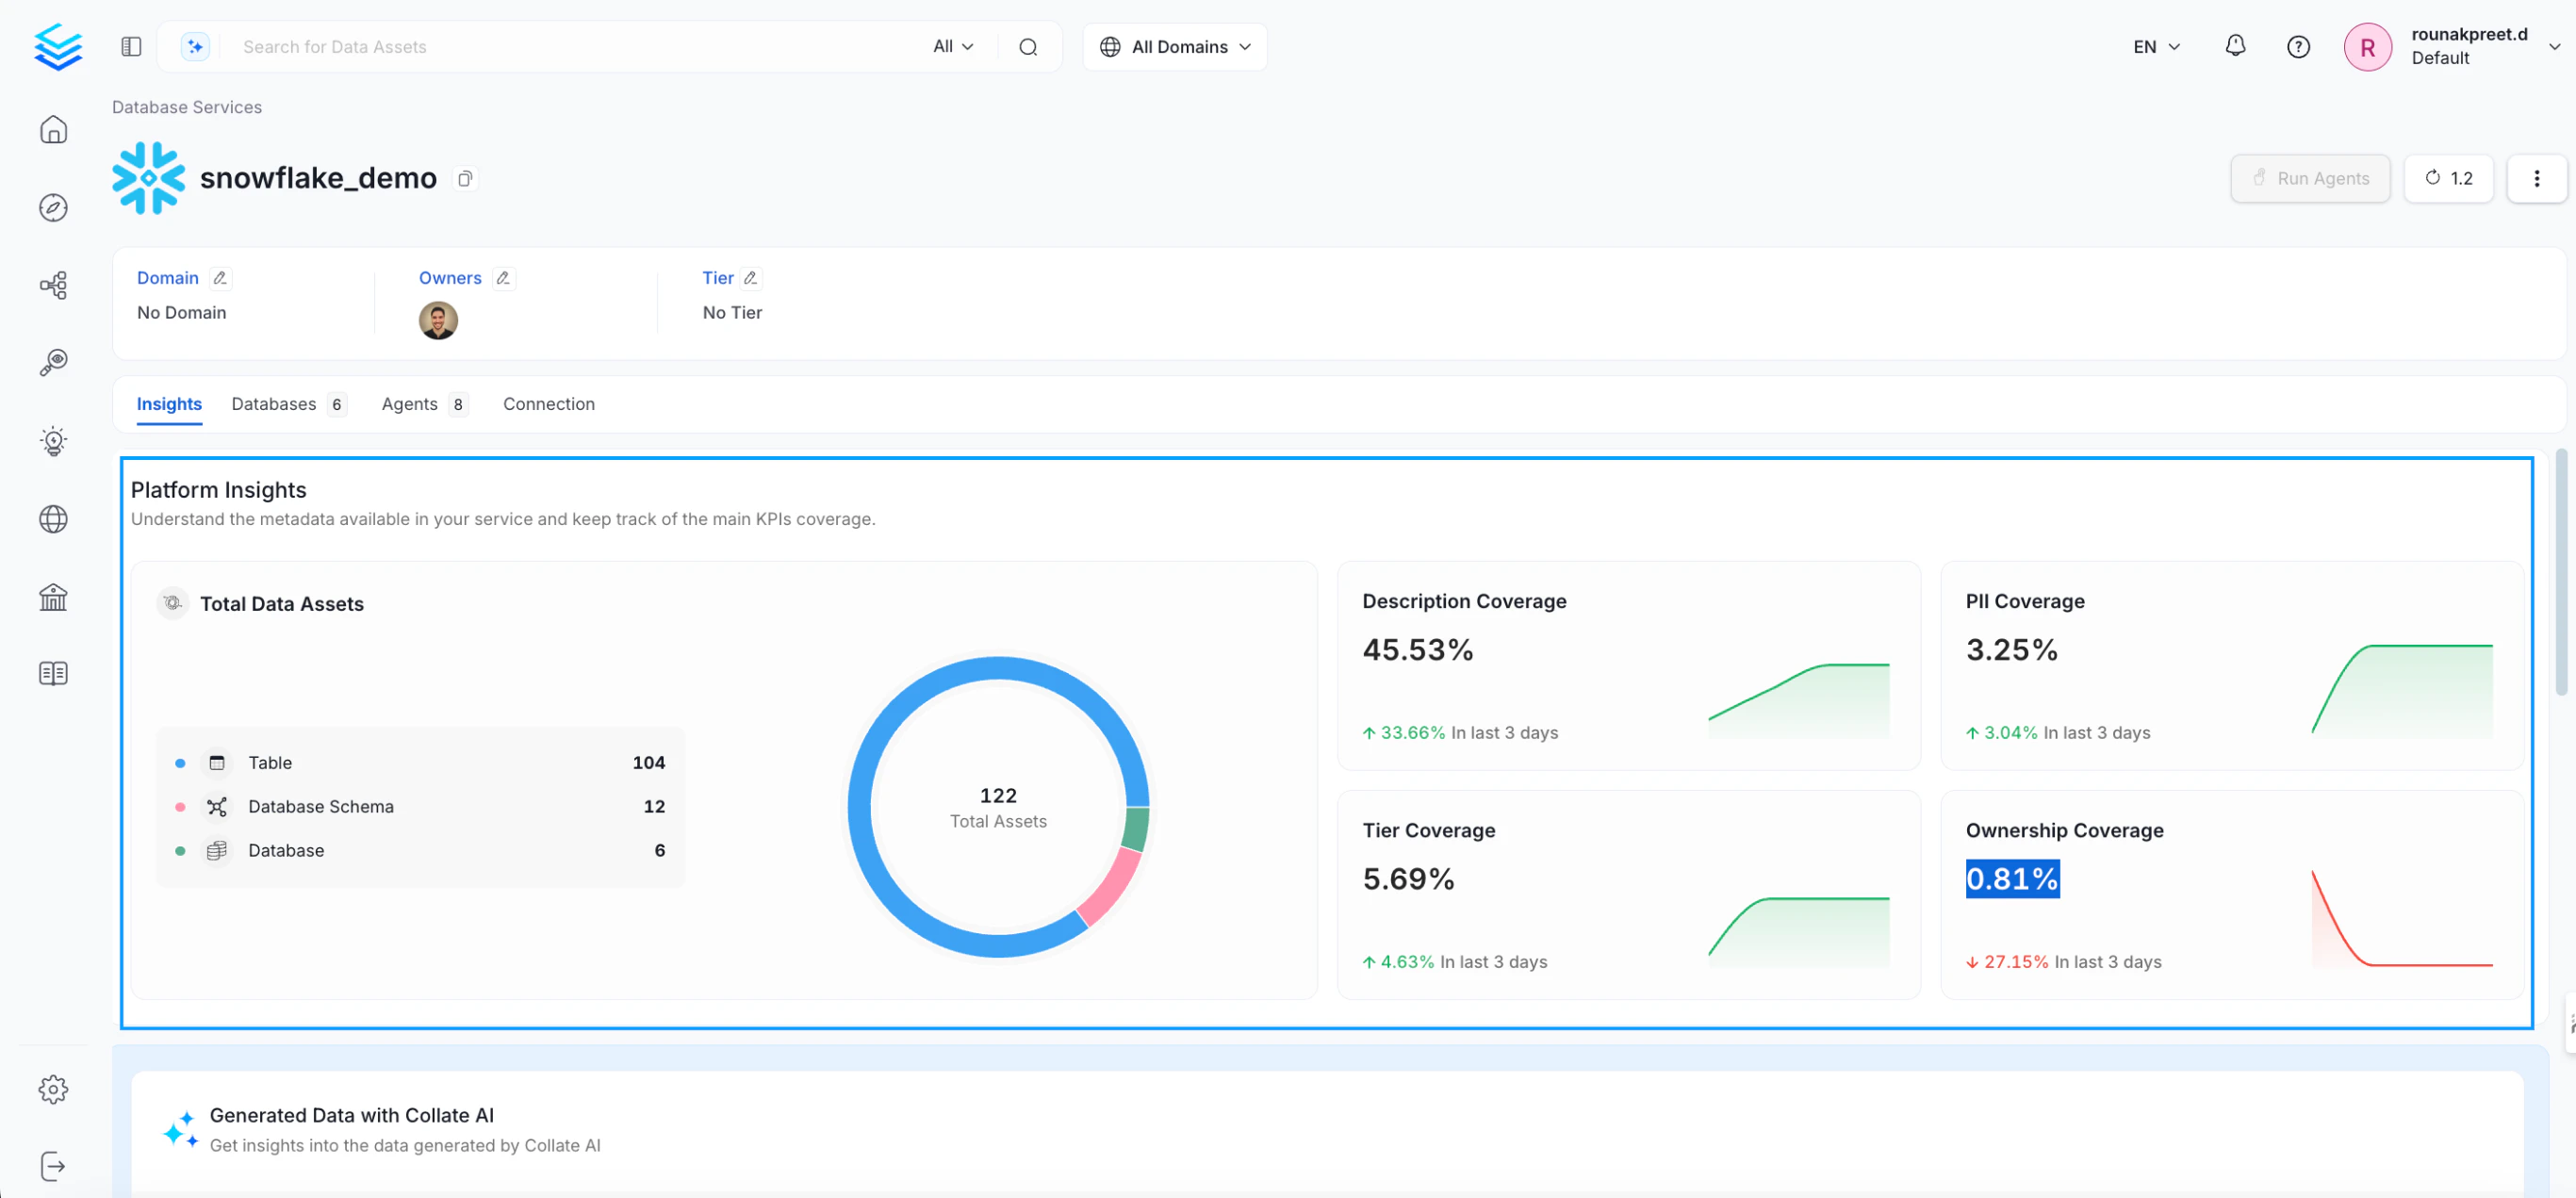
Generated Data with OpenMetadata AI (OpenMetadata Only)
This table displays a breakdown of metadata populated by the OpenMetadata AI agent versus metadata populated manually.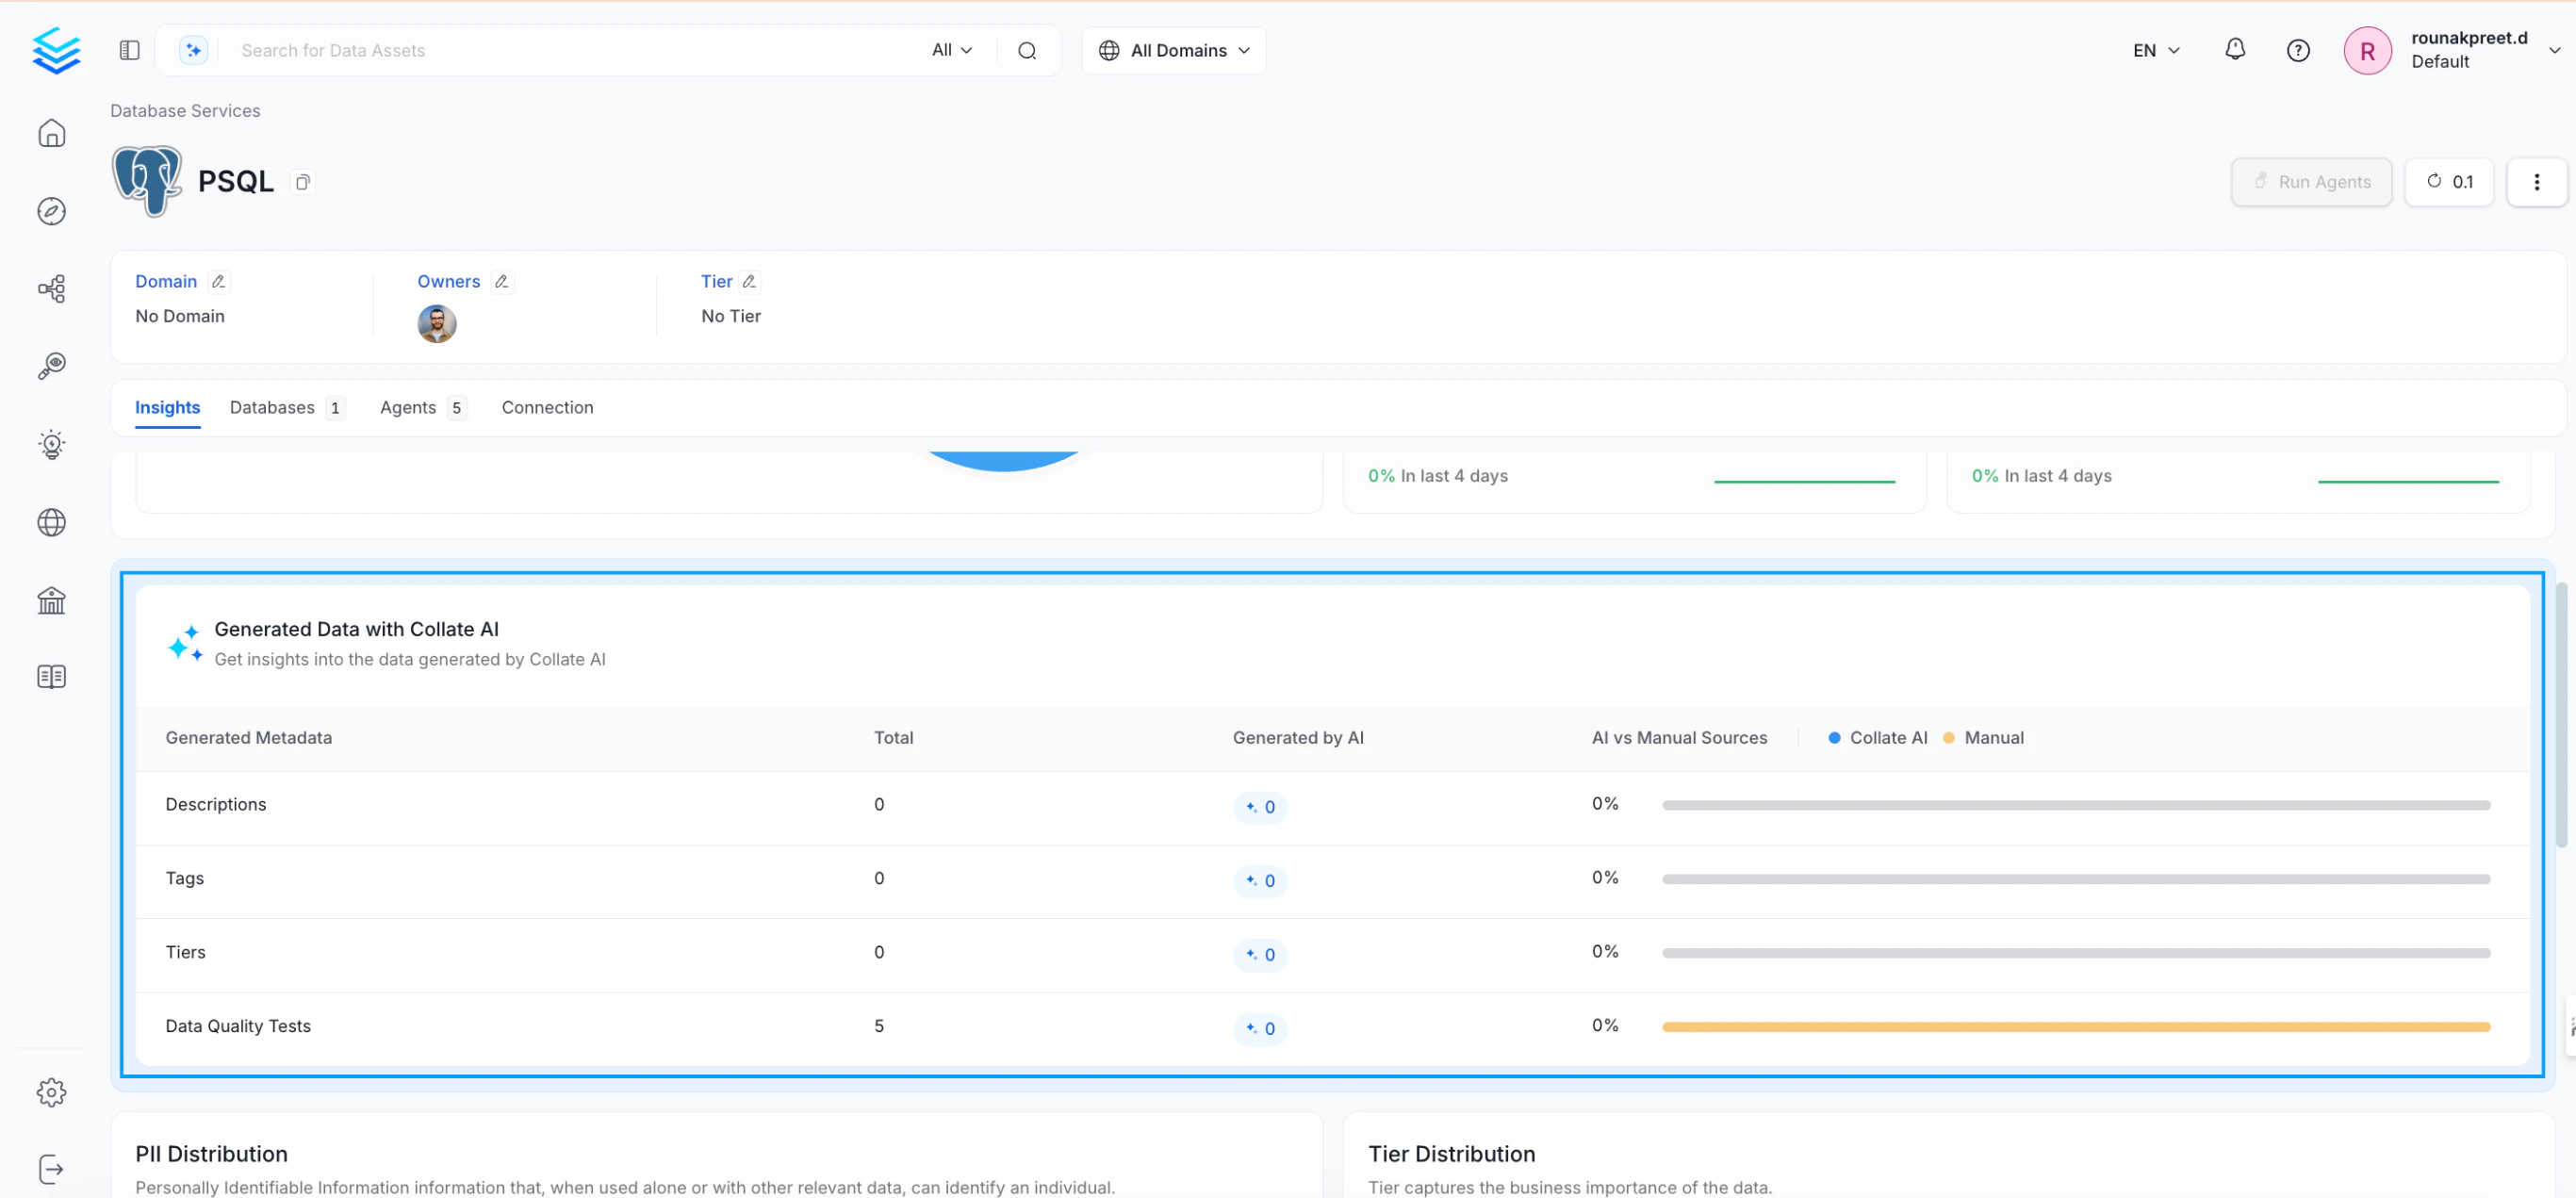
PII Distribution
This table displays a breakdown of data assets categorized by their associated PII (Personally Identifiable Information) tags.Tier Distribution
This table provides a breakdown of data assets based on their assigned Tier classification.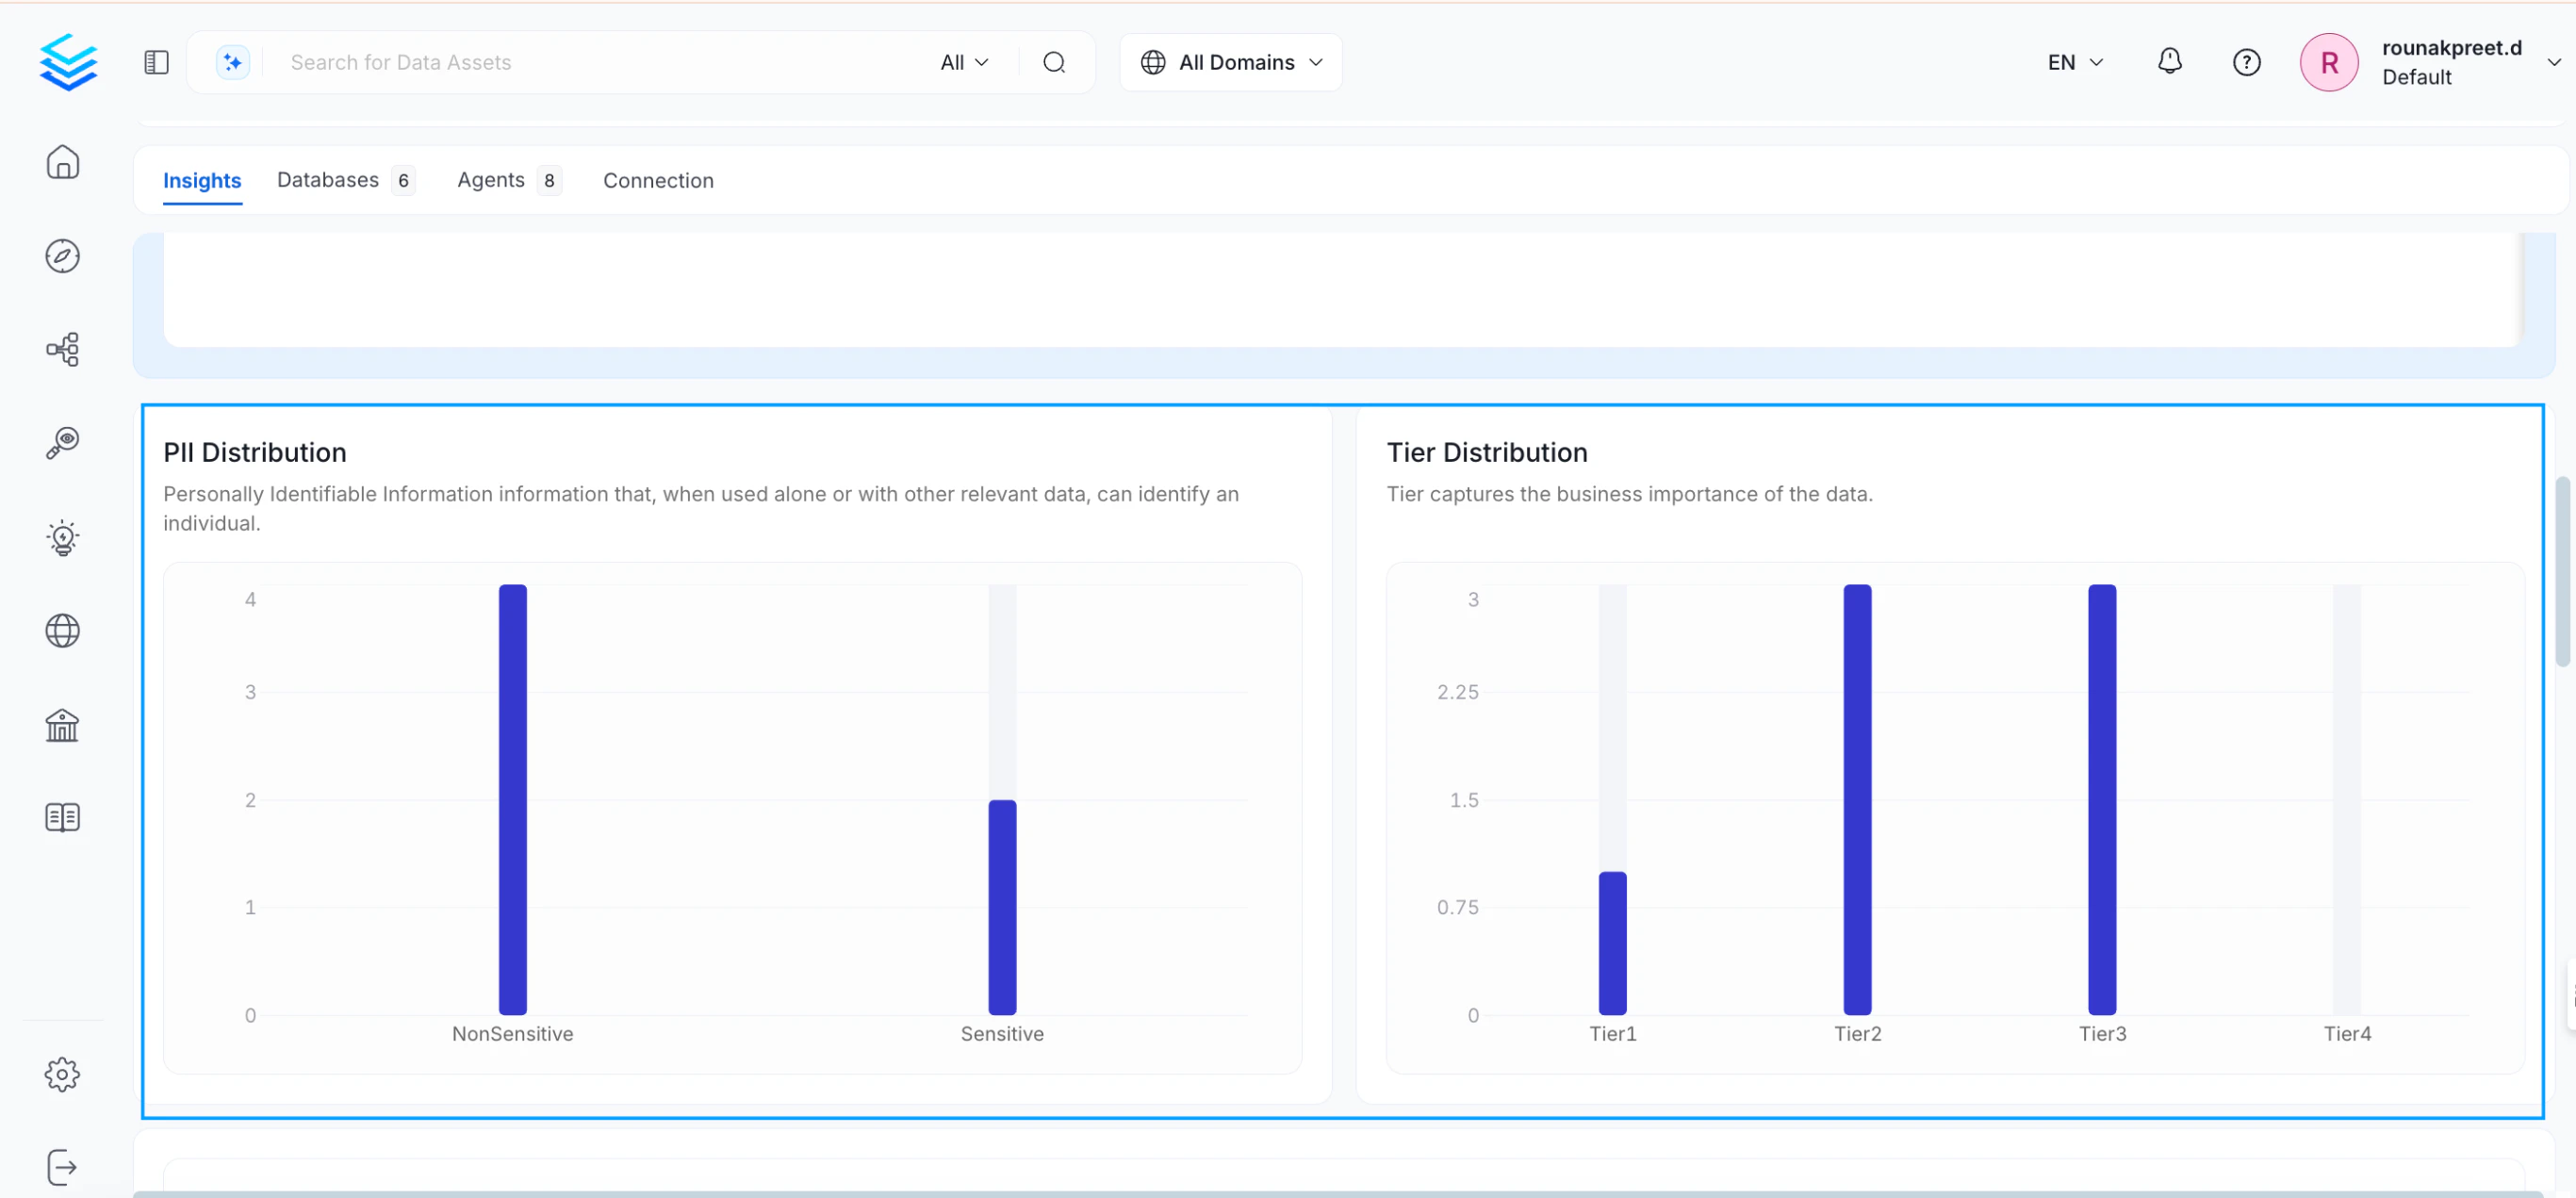
Most Used Data Assets
This table displays the top five most frequently accessed data assets, determined by their usage percentile.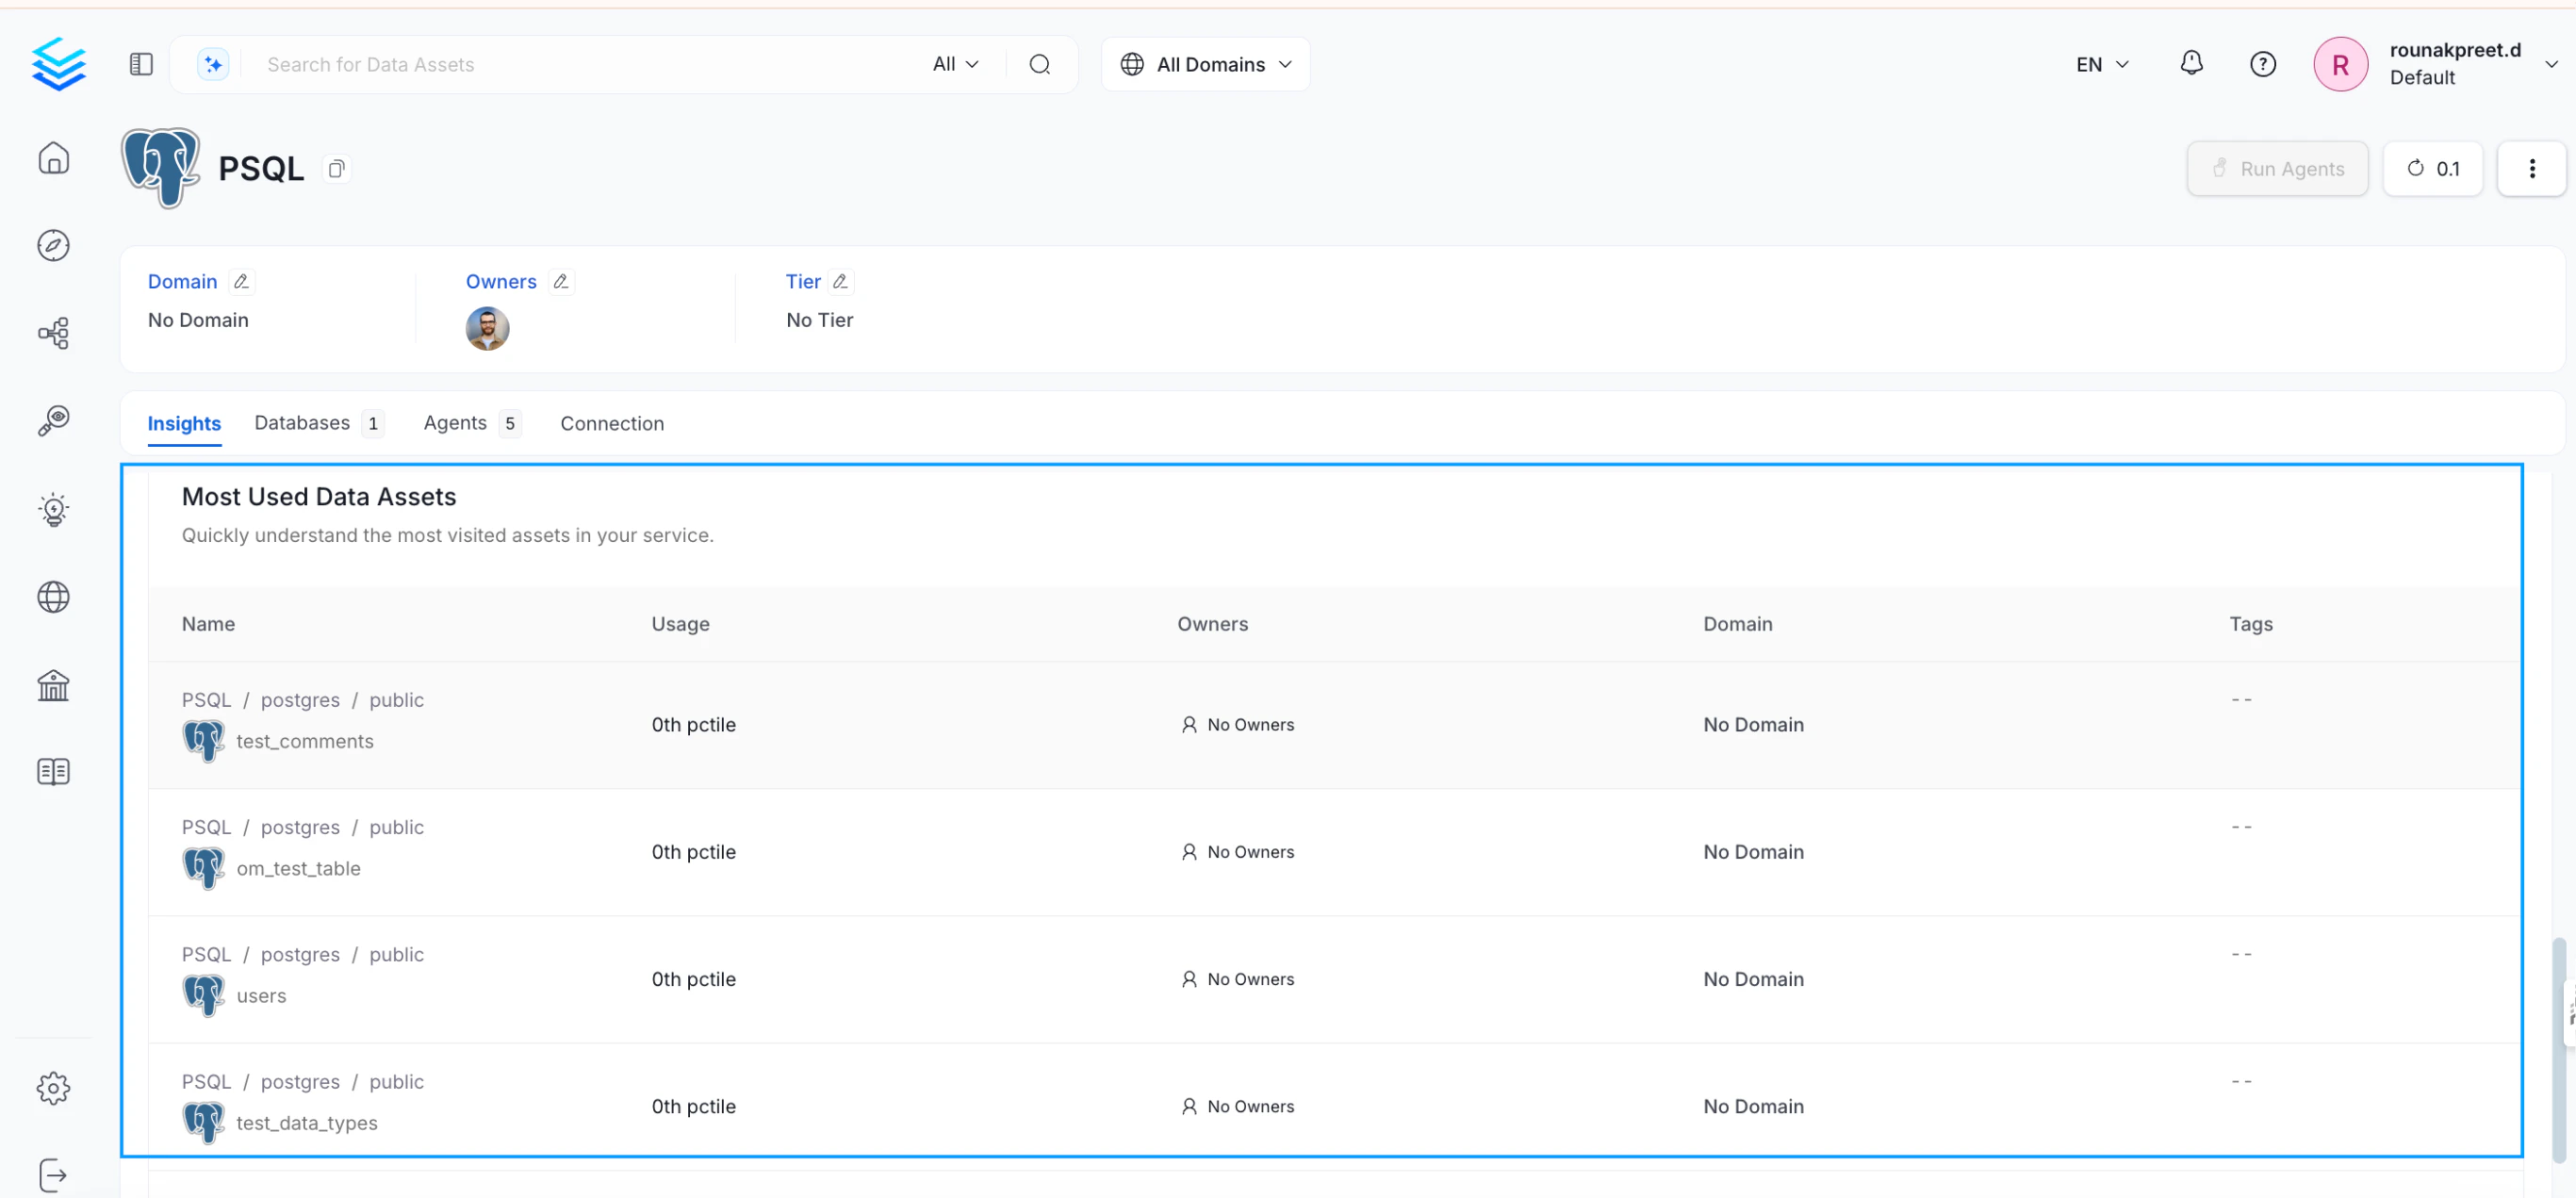
Most Expensive Queries
This table displays the top queries based on the cost of query execution.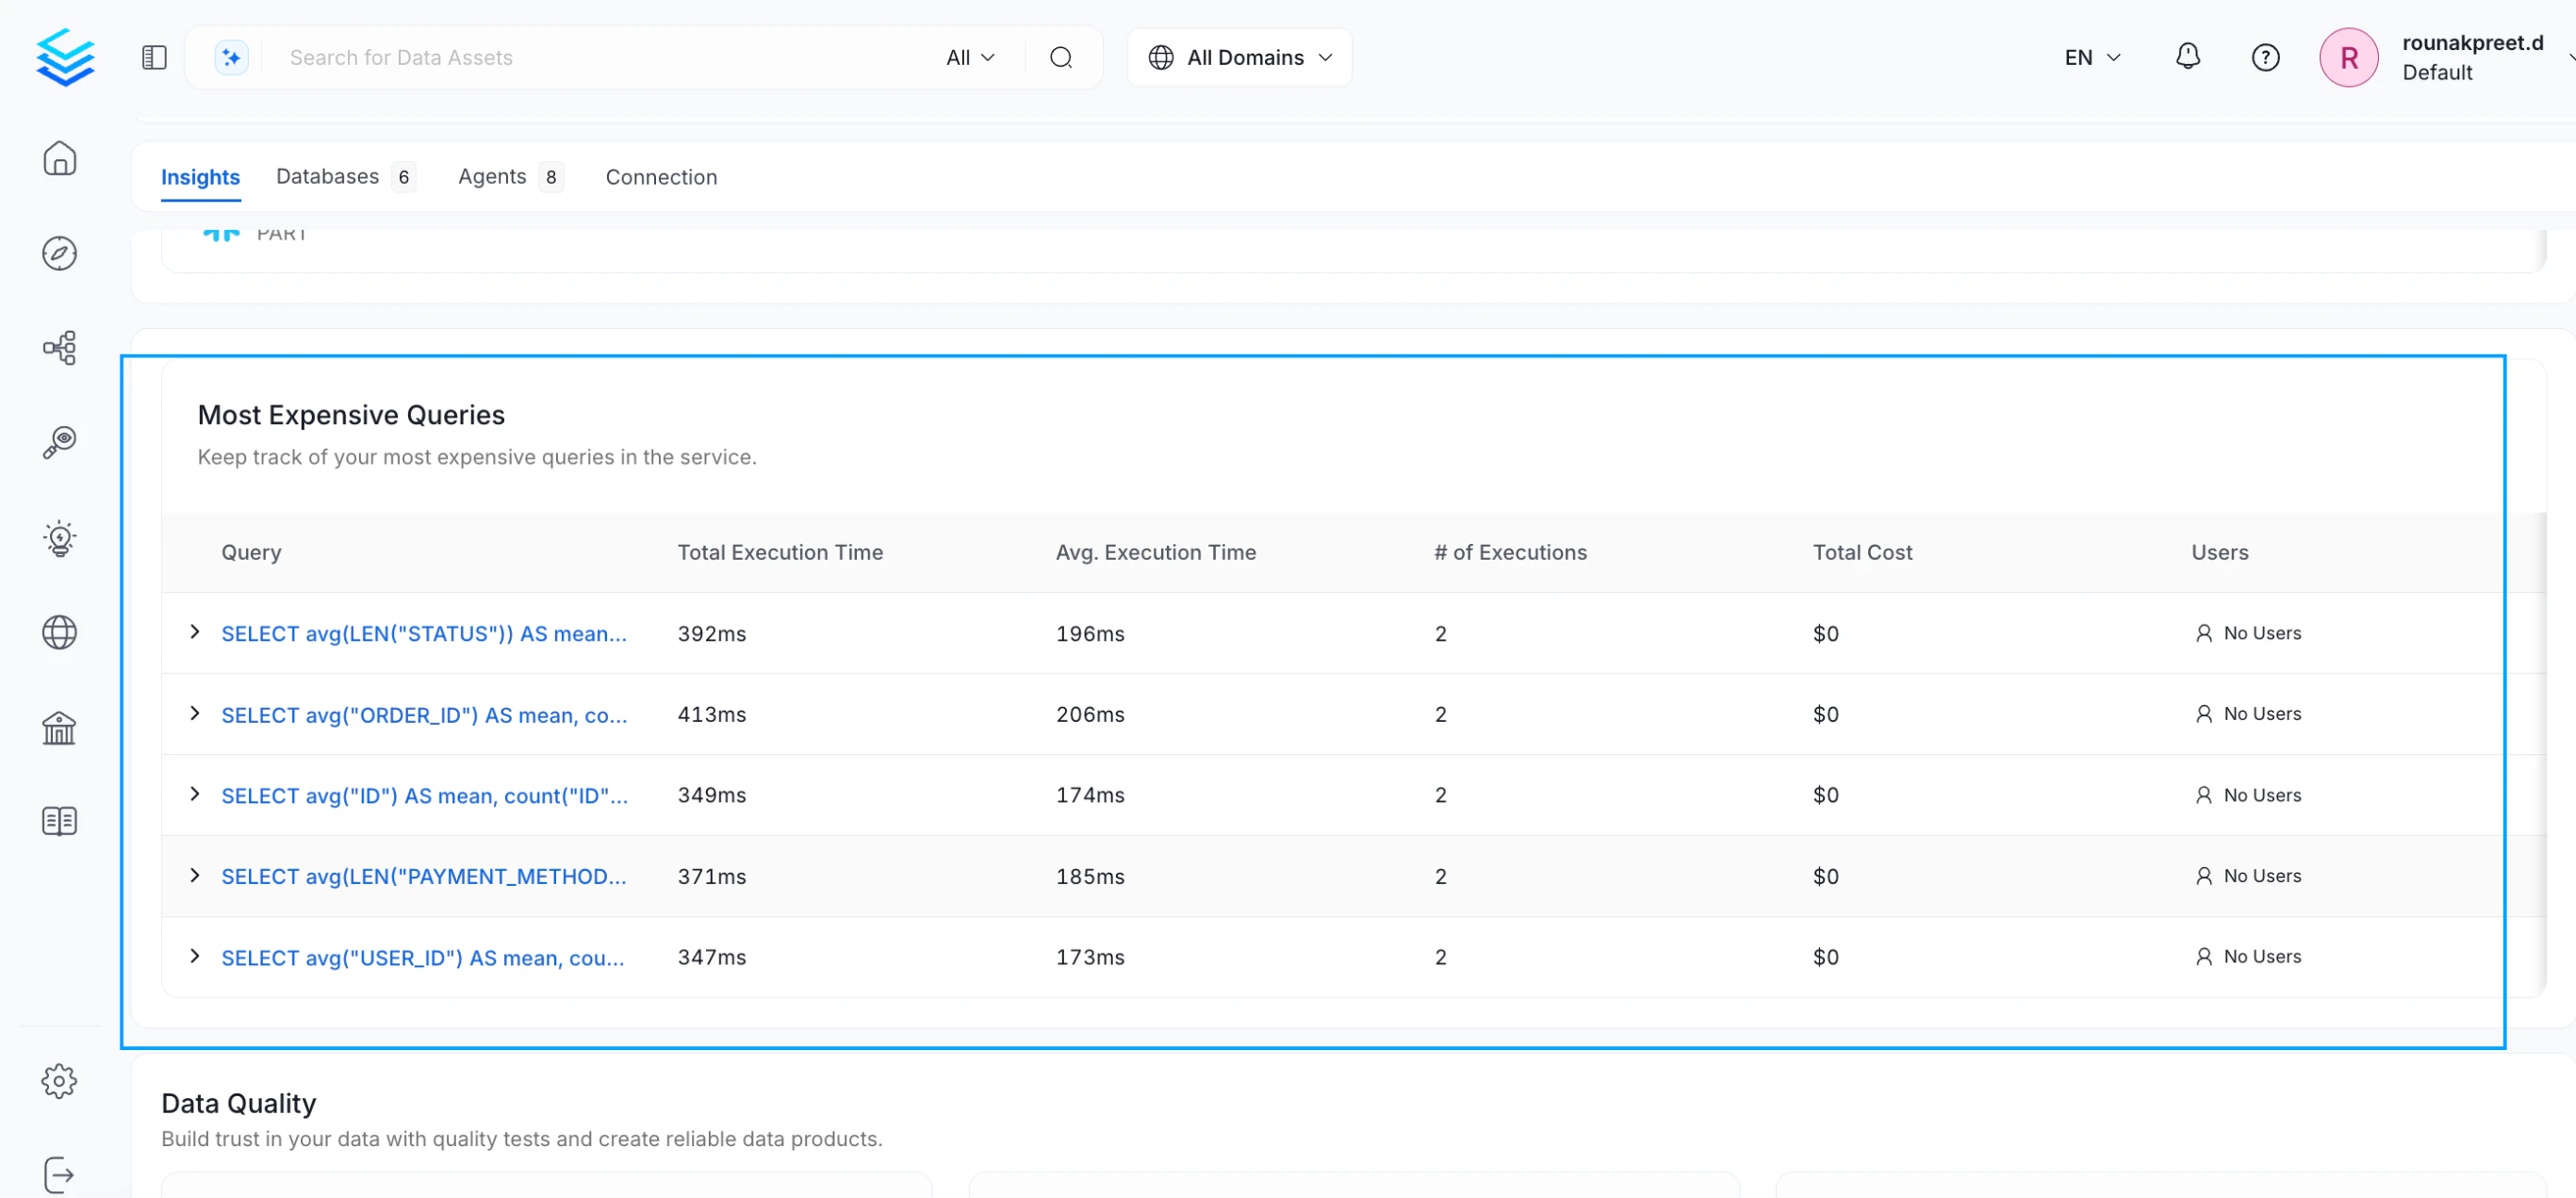
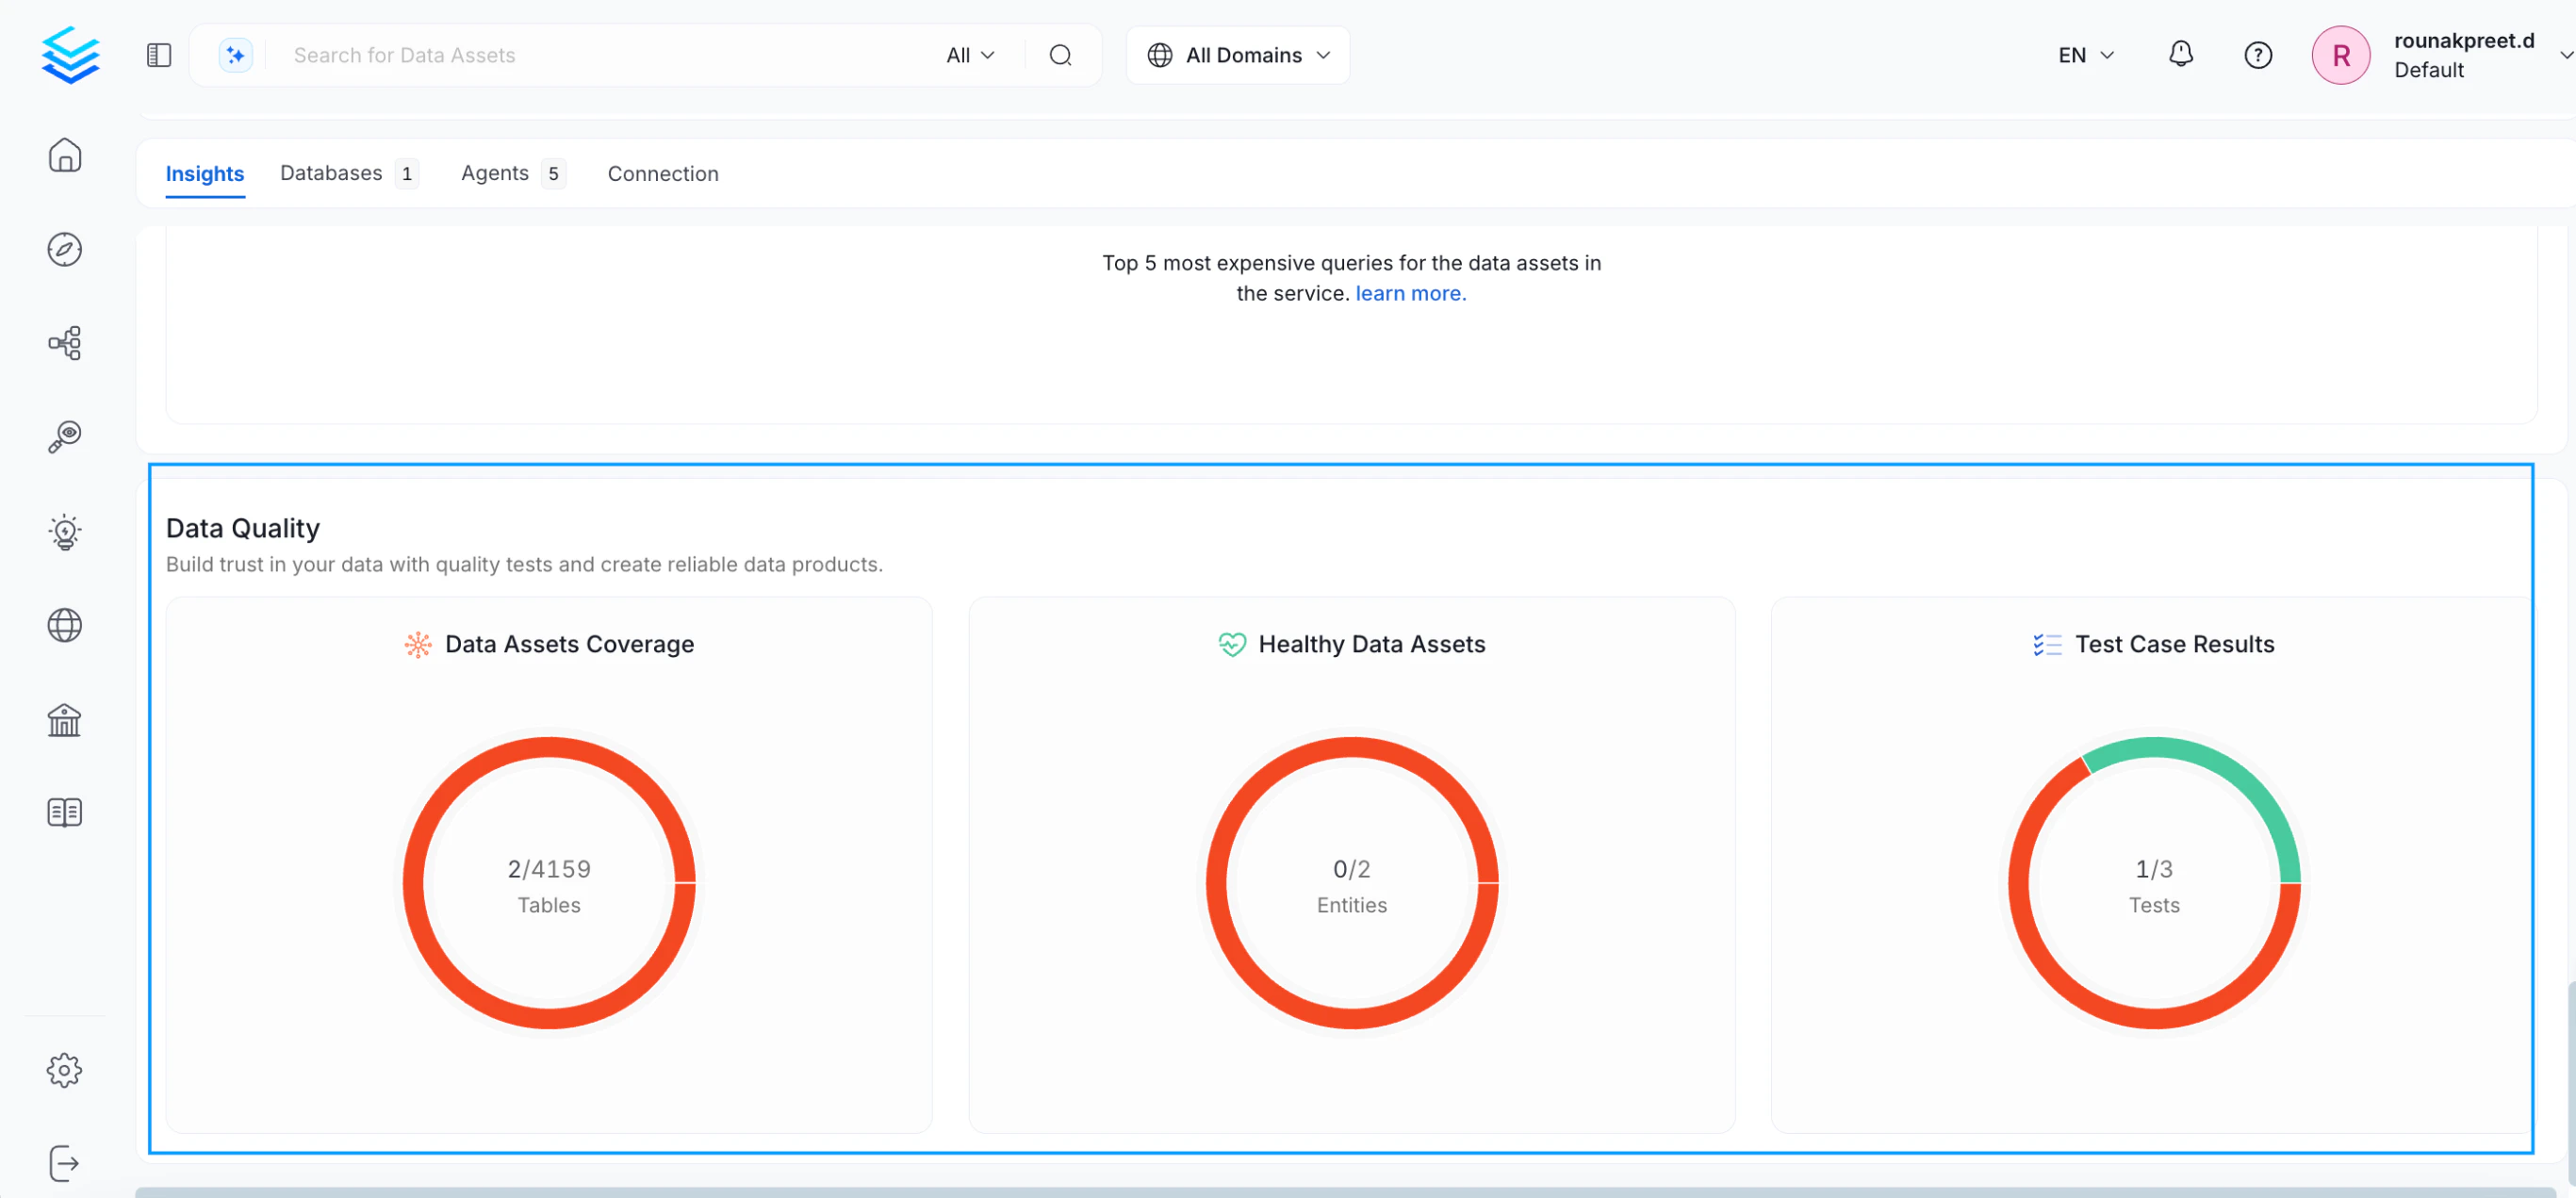
Data Quality
This chart shows the percentage of data assets that have one or more data quality tests configured.